Techniques
to measure plant cell water and solute relations
- Using the micro pressure probe to measure cell turgor
pressure
- Single cell sampling to extract vacuolar sap
- Aphid stylectomy to extract phloem sap
- Using insects to extract xylem sap
- Analysis of osmotic pressure, inorganic
and organic solutes
- Monitoring aphid feeding behaviour
Using the pressure probe to measure single cell turgor pressure
Collection
of vacuolar sap
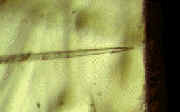
Microcapilaries attached to the pressure
probe or mounted alone are inserted into vacuolate cells. The pressure in the cell forces
the sap into the capillary and it can be collected and analysed. Volumes collected can
range from a few picolitres to 100 picolitres depending on cell size, elasticity and
turgor. A constriction pipette in use can be seen here. Some of these techniques were developed
in the lab of Deri Tomos at
University of Wales, Bangor.
Cutting
aphid stylets to sample phloem sap
 Phloem sieve elements are difficult
to sample, requiring cutting or techniques which may alter its composition. Aphids can
insert their stylets into the phloem and feed on the sieve element sap. Using radio
frequency microcautery we can cut the stylets and collect sap from phloem sieve elements
for subsequent analysis (ref).
Photosynthesis produces all the carbon on the planet but the regulation of translocation
through the phloem is poorly understood. Our studies are helping us understand the
regualtion of translocation and its modification by environmental stress.
Phloem sieve elements are difficult
to sample, requiring cutting or techniques which may alter its composition. Aphids can
insert their stylets into the phloem and feed on the sieve element sap. Using radio
frequency microcautery we can cut the stylets and collect sap from phloem sieve elements
for subsequent analysis (ref).
Photosynthesis produces all the carbon on the planet but the regulation of translocation
through the phloem is poorly understood. Our studies are helping us understand the
regualtion of translocation and its modification by environmental stress.
Click here to see an avi movie of a
stylet being cut, its BIG (and it doesn't exude!).It does work, an exuding stylet can be
seen here
 |
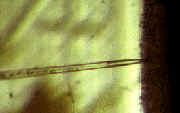
Aphids feeding on barley leaf, as microcautery
needle is introduced |
 |
Aphid feeding on barley root |
 |
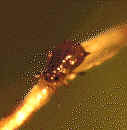
Cut aphid stylet showing exuding sieve element
sap |
Insects to sample the xylem
The insect Philaenus spumarius inserts its stylet into the xylem and
can extract sap against large negative pressures (tensions) often present in the xylem. In
the nymphs of P. spumarius the excess xylem sap is expelled and frothed up,
forming the cuckoo spit often seen on plants in the spring. This can be collected and
xylem composition analysed. The adult leaf hopper expels the
excess sap, without frothing, as discrete droplets. This fluid can also be collected and
analysed.
In collabration with Mike Malone at HRI Wellesbourne we are developing
collection techniques to validate the method and apply it to understanding salt tolerance
in plants (ref). We are also using aphids to sample the phloem to get a picture of whole
plant responses to salt.
|
 |
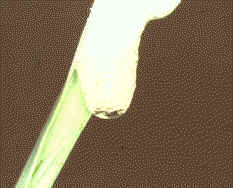
| Cuckoo spit
mass on barley leaf |
Adult Philaenus
expelling xylem sap |
Osmotic
pressure measurement
Osmotic pressure is measured by freezing
point depression of picolitre quantitiies of sap. Samples are frozen to -40oC
to avoid supercooling and temperature is slowly raised. Temperature at which the last ice
crystal melts is recorded. The osmometer is calibrated with NaCl standards of known
osmotic pressure. An AVI of the melting ice on the osmometer stage can be seen here
 |
Frozen samples on the osmometer stage |
Inorganics
Inorganic ions are measured using EDAX
analysis of flash-evaporated samples of extracted sap. Typical volumes used are around 10
picolitres. Calibration is facilitated by adding internal standards, usually RbFl. A study
of maize roots using these techniques can be found in the publication
list. An AVI of the pipetting of an EDAX grid can be seen here.

|

|
| Pioloform coated EM copper grid |
EM picture of flash-evaporated samples |
Organics
Organic solutes can be analysed using
appropriate dehydrogenase enzymes linked to NAPH/NAPDH conversions. Changes in
fluorescence are proportional to the solute under consideration and can be quantified
using the confocal microscope.
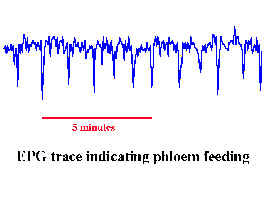
Aphid
feeding behaviour
Aphid feeding behaviour can be monitored
using EPG. The aphid is linked into an electrical circuit. Different characteristic
signals are generated depending which plant compartment (cell, xylem, phloem etc.) the
aphid stylet is located in.
Home